What is Order Fill Rate and Why Should You Care?
As a small business owner of a wholesale or distribution business, there are so many metrics that you can apply to your business to assess your relative performance. Aside from the usual profit and cash flow ratios — two important metrics that are always on your mind — other metrics judge just how efficiently your business is doing with inventory management.
The order fill rate is one such metric that you need to pay attention to. We’ll cover what this term means and why it matters to your business. Then we’ll see how you can calculate it. Finally, we’ll review some measures that you can take to improve your order fill rate now.
Quick Links
- What is Order Fill Rate?
- How Do You Calculate Order Fill Rate?
- Why is Order Fill Rate Important?
- How Can You Improve Your Order Fill Rate?
What is Order Fill Rate?
The order fill rate simply refers to the percentage of customer orders that are immediately fulfilled by available stock. It is also known as the demand satisfaction rate because customer satisfaction is closely tied to how many orders that can be filled by stock on hand. A satisfied customer will see all or most of their orders fulfilled and shipped immediately. An unhappy customer will experience stock-outs and delays in replenishing stock. Your relationship with an unhappy customer will suffer.

Like a health checkup, any ratio or number should not be read in isolation. You need to consider it in a basket of inventory management metrics to evaluate just how well your business is doing. A high order fill rate may mask other inefficiencies in your business. And a low fill rate may not be representative of your seasonal sales.
Unfortunately, there’s no standard or agreed-upon measure of order fill rate across businesses and industries. Companies use different ways of calculating order fill rate according to their needs. Thus, you cannot readily compare one fill rate from a business to another. However, a general rule of thumb is that you should be fulfilling 92-98% of your orders.
How Do You Calculate Order Fill Rate?
You can calculate fill rates for line items, SKU or cases for individual invoices. In addition, you can also calculate them across invoices. The various methods that businesses use means that it is not simple to compare one firm’s order fill rate with another. Let’s look at the following two example invoices shipped in units of cases.
                          Invoice 1
   Line   SKU   Qty Ordered   Qty Shipped   Line Count Fill Rate
    1     101   30            25            0
    2     102   50            50            1
    3     103   20            20            1
    4     104   80            60            0
    5     105   20            20            1

  Total         200           175           3

  Case fill rate = 175/200 = 87.5%
  Line count fill rate = 3/5 = 60%


                          Invoice 2    Line   SKU   Qty Ordered   Qty Shipped   Line Count Fill Rate
    1     101   20            20            1
    2     102   40            38            0
    3     103   50            48            0
    4     104   10            10            1

  Total         120           116           1

  Case fill rate = 116/120 = 96.6%
  Line count fill rate = 2/4 = 50%
For the individual invoices, the case fill rate of 87.5% for invoice 1 and 96.6% for invoice 2 are calculated across SKUs. The line count fill rate is 60% for invoice 1 and 50% for invoice 2.
Aggregating the two invoices, the case fill rate then becomes (175+106)/(200+110) = 90.6%. Likewise, the line fill rate is (3+1)/(5+4) = 44.44%. Drilling down to individual SKU, the fill rate for SKU 104 is (60+10)/(80+10) = 77.77%.
So you can see from this example that invoice 2 looks like the best performing invoice because you managed to fulfill 96.6% of the quantity ordered. However, from a line count fill rate perspective, you only fulfilled half of your orders.
Overall, it’s best to look at the aggregated case fill rate of 90.6% if you wish to get a gauge on how well you are shipping out complete orders. There’s still room for improve to bring up this number and looking at individual invoices and SKU will help you to troubleshoot where your incomplete orders are.
Why is Order Fill Rate Important?
This seemingly simple metric is a measure of how well your business can meet customer demand. A high order fill rate suggests that you are managing your inventory levels efficiently to avoid stock-outs. You are forecasting demand accurately, replenishing your inventory on time, and providing sufficient safety stock. Thus you are able to fulfill customer orders immediately.
However, a high fill rate may also mask an overstocked scenario. While the ratio shows how well you are fulfilling customer orders, it does not suggest an efficient level of stock to minimize obsolescence, loss, damage, or deadstock. Nor does this ratio offer any insight into which product lines are bestsellers and which are failures. Thus, this metric needs to be seen in the company of other important inventory ratios.
On the flip side, a low order fill rate is a sign that you need to get your demand forecasting and purchasing strategy in order. This means that you can barely fulfill a portion of customer orders at a given point in time. You’re experiencing stock-outs because perhaps you’re pushing Just-In-Time too far or you have provided insufficient buffer stock. Customers will be unhappy and they may take their future purchases to your competitors.
Similarly, a low order fill rate isn’t all doom and gloom. While it does suggest that you’re doing a poor job in fulfilling customer orders, a low ratio can happen for various reasons. You may have been caught off-guard by a sudden surge in demand for a product that’s gone viral. Or a series of seasonal sales in quick succession — such as Thanksgiving, Black Friday, Cyber Monday and Small Business Saturday — left you with low stock levels that we not able to be replenished in time because your suppliers were closed for the holidays.
How Can You Improve Your Order Fill Rate?
A. Invest in Real-Time Stock Information
Your sales representatives are working in the field. They’re visiting retailers, emailing quotations, and filling in sales orders. Why not give them the tools and information to keep them informed about your inventory date? Better still, the stock levels should be updated in real time by using inventory management software. This way you don’t sell products that are unavailable or limited in stock, reducing the risk of unfilled orders in the first place. Being informed means they’re likely to ship complete orders to retailers. And fulfilling more complete orders means a higher fill rate.
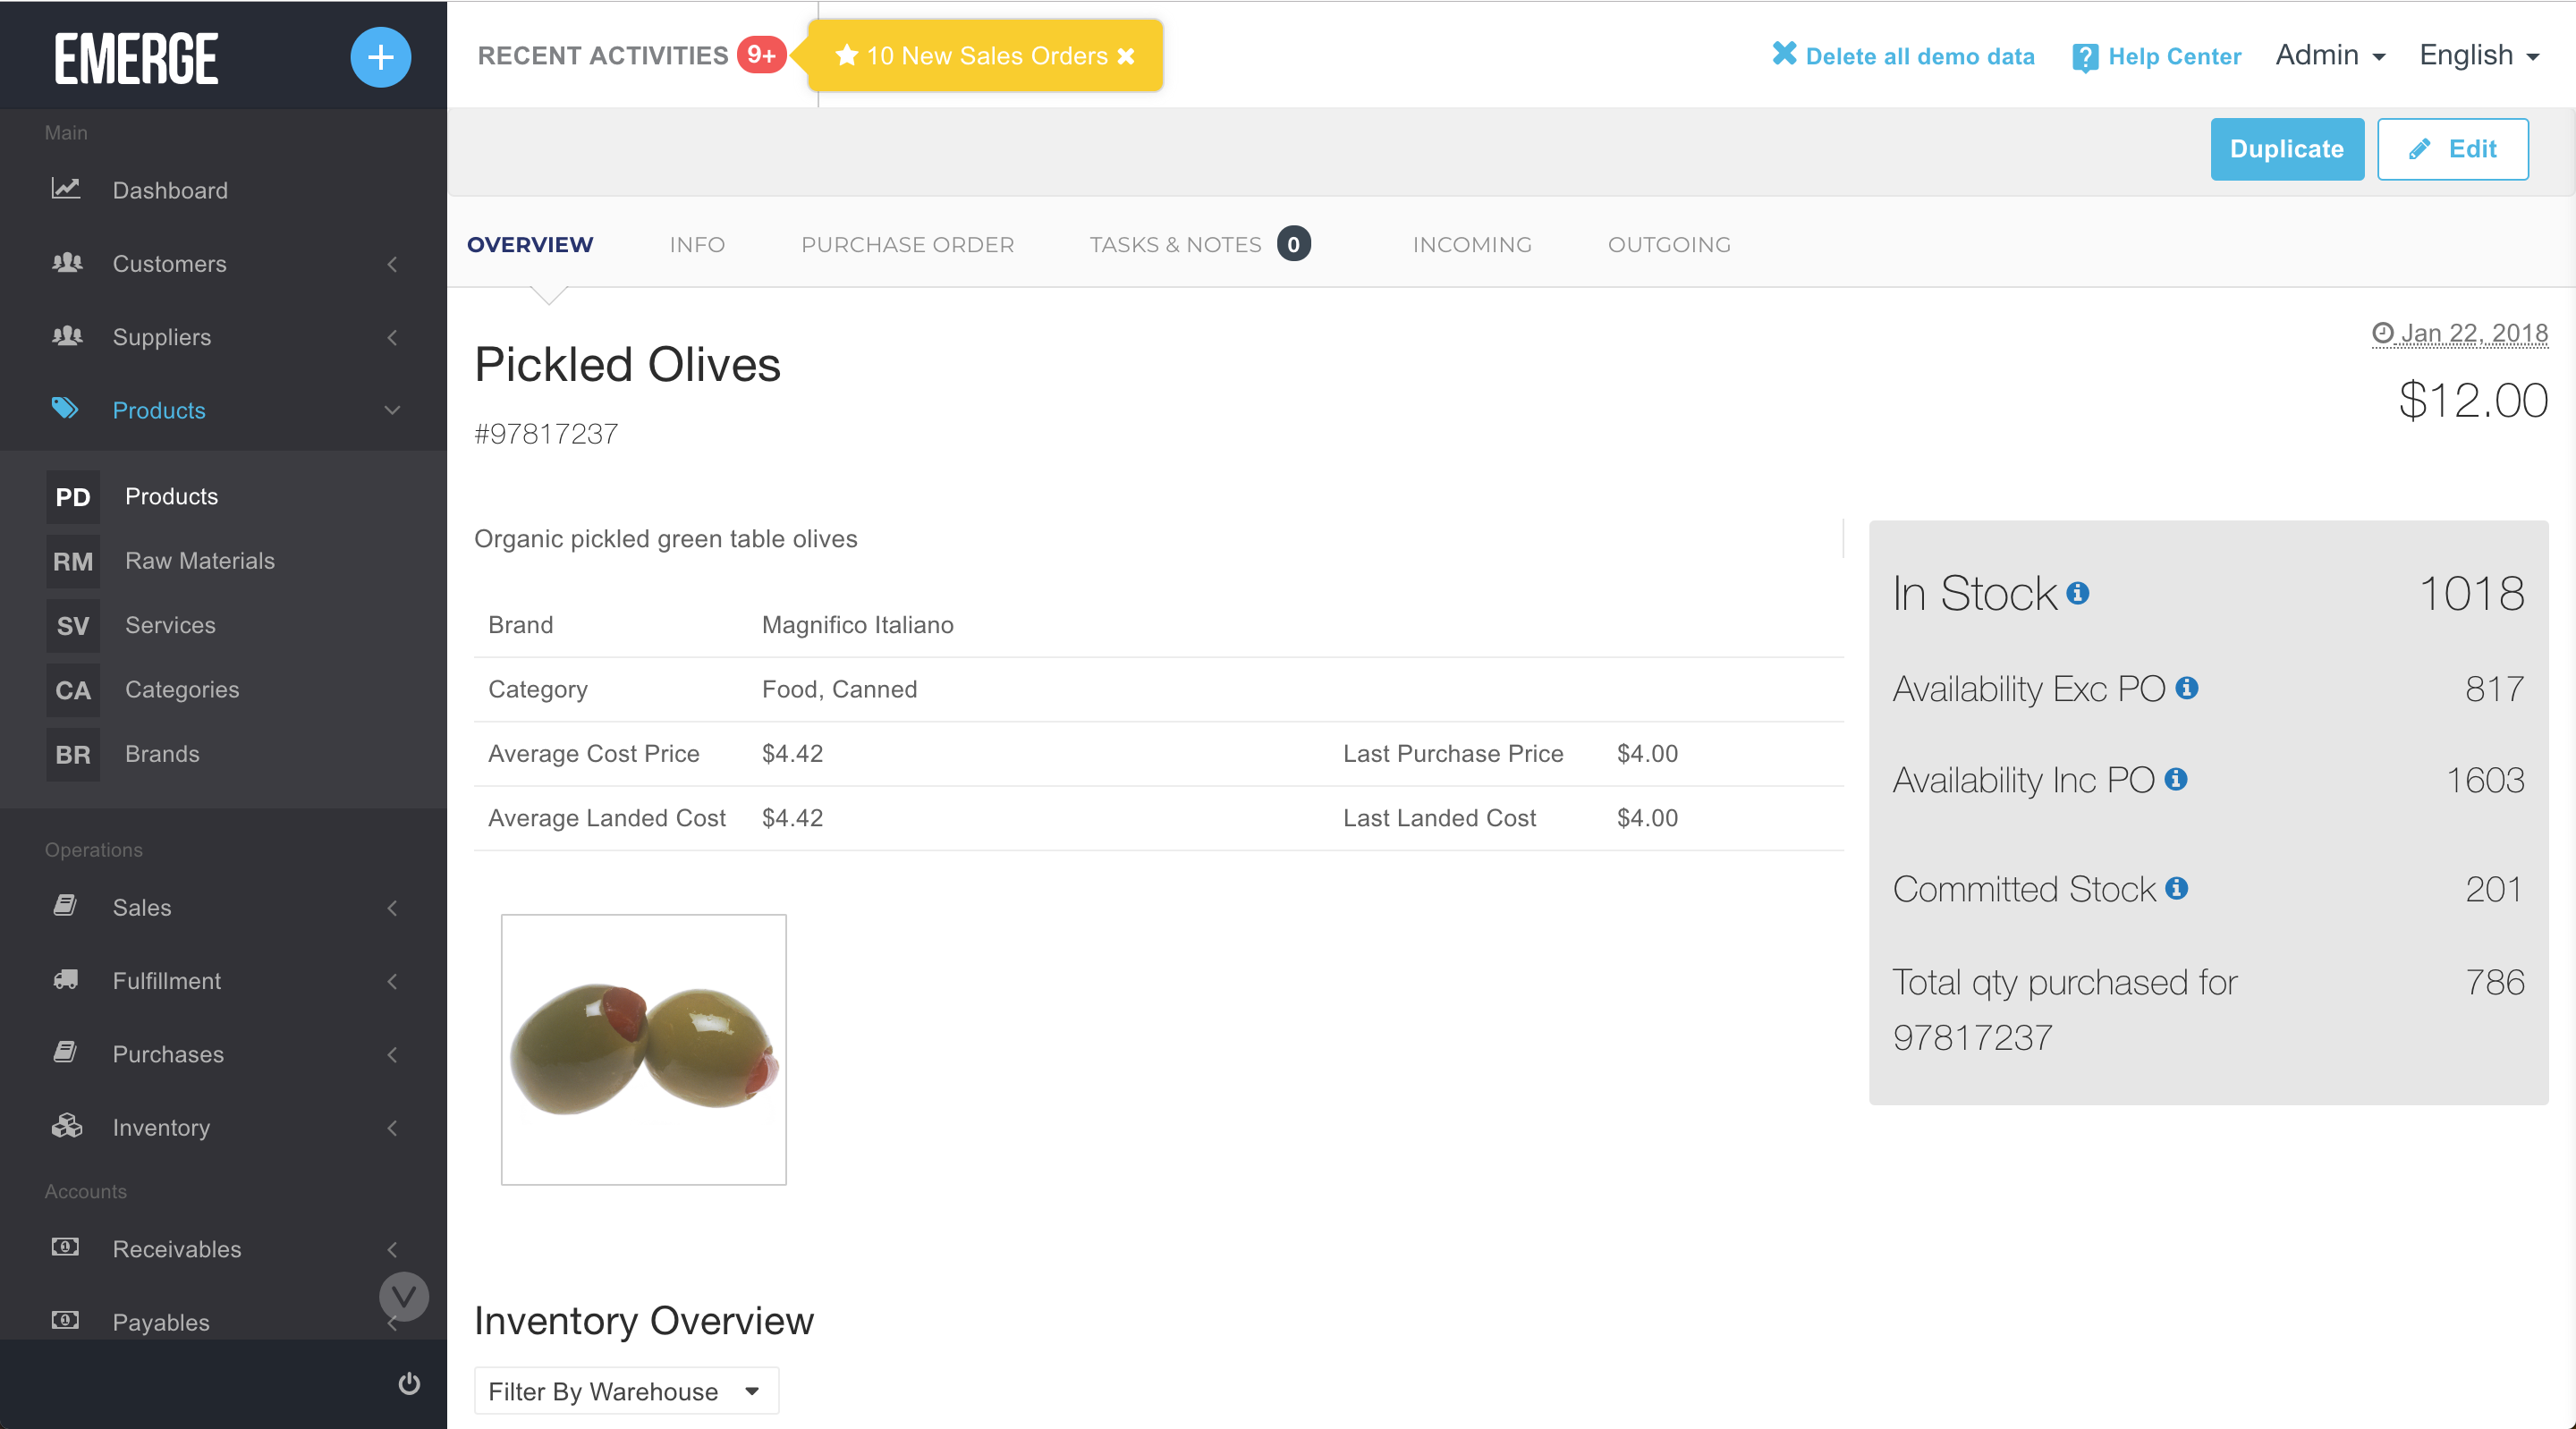
For example, your top salesperson sells your imported food products to catering firms and large hotel food & beverage outlets. Your San Marzano tinned tomatoes consistently sell out because of their exquisite flavor and low acidity. Checking your real-time stock levels via EMERGE App, your salesperson sees that San Marzano tomatoes are out of stock and back ordered for delivery in a month from Italy. Knowing that your customers cannot wait, your salesperson suggests they stock up on ordinary tinned plum tomatoes instead. While they may not share the same taste profile, they are considerably cheaper and your customers could run specials for dishes featuring them.
B. Improve Your Sales Forecasting and Purchasing Patterns
Other than real-time information, historical data is immensely useful when forecasting sales for particular products. The more historical data the better, so get about 3 to 5 years worth. Then overlay this data against consumer buying patterns and your current sales order. From this, you should be able to see what products you should order, how much to order, and when you should order them. And don’t forget the impact of seasonal trends and events.
For example, let’s say that your retail customers find that sales of baby nappies and beer spike in the countdown to Super Bowl. Why? It’s because when young dads are tasked to buy baby nappies at the local supermarket, they often pick up packs of beer alongside as well. So in the lead up to the first Sunday in February, you want to make sure that your wholesale supplies of baby nappies and beer are ordered well in advance and with a sufficient safety stock.
C. Offer Alternatives and Substitutes
Retail rent and shelf space are expensive. Stores don’t want customers to see gaping holes in shelf space or an “out of stock” sticker where products once sat. Customers will simply bring their purchases somewhere else. So for retailers to avoiding gaps in their range, you should offer alternatives and substitutes for products that are out of stock or face a long delivery cycle. The idea is to fill the balance of the order with similar products that are available immediately.
For example, you’re a distributor of access control devices from Japan. Your products are premium-priced. They have built-in facial recognition AI and biometric security measures. A large order suddenly lands in your lap one day to outfit a new stadium. You know that you can’t supply the quantity required because you only keep minimal stock due to their high prices. So you quickly source an alternative product from China that is one-third of the price, does something similar, and that is ready for shipment directly from your supplier.
Conclusion
By now you would have had your fill of order fill rates. It’s not the most critical inventory management ratio out there but it’s a useful one. You can use it to judge how well your business is doing in meeting customer orders. While you should not judge your business performance on this ratio alone, the result may help you to investigate other areas of your business or workflow so that you can improve your order fill rate.